Exercises: Random Intercept and Random Slope Models
Question 1
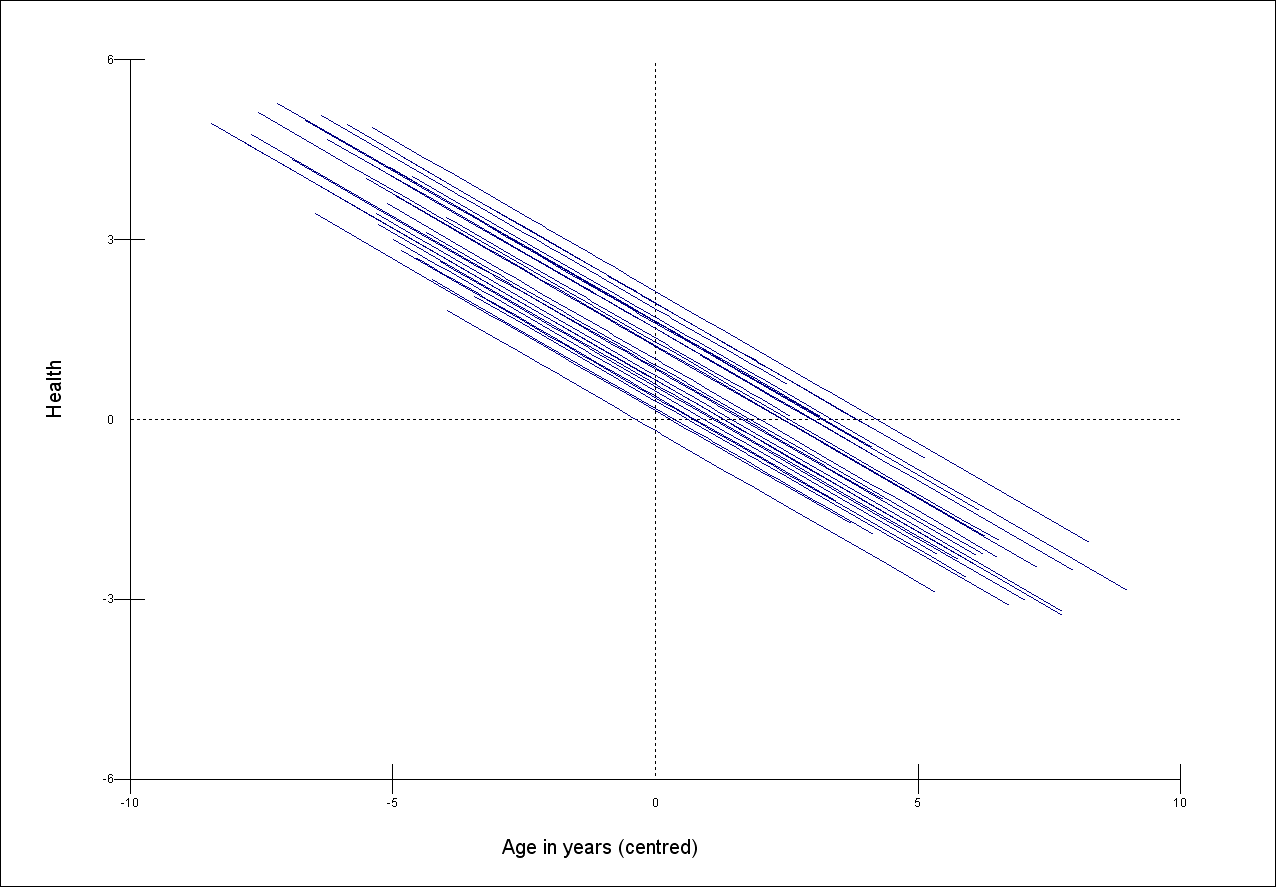
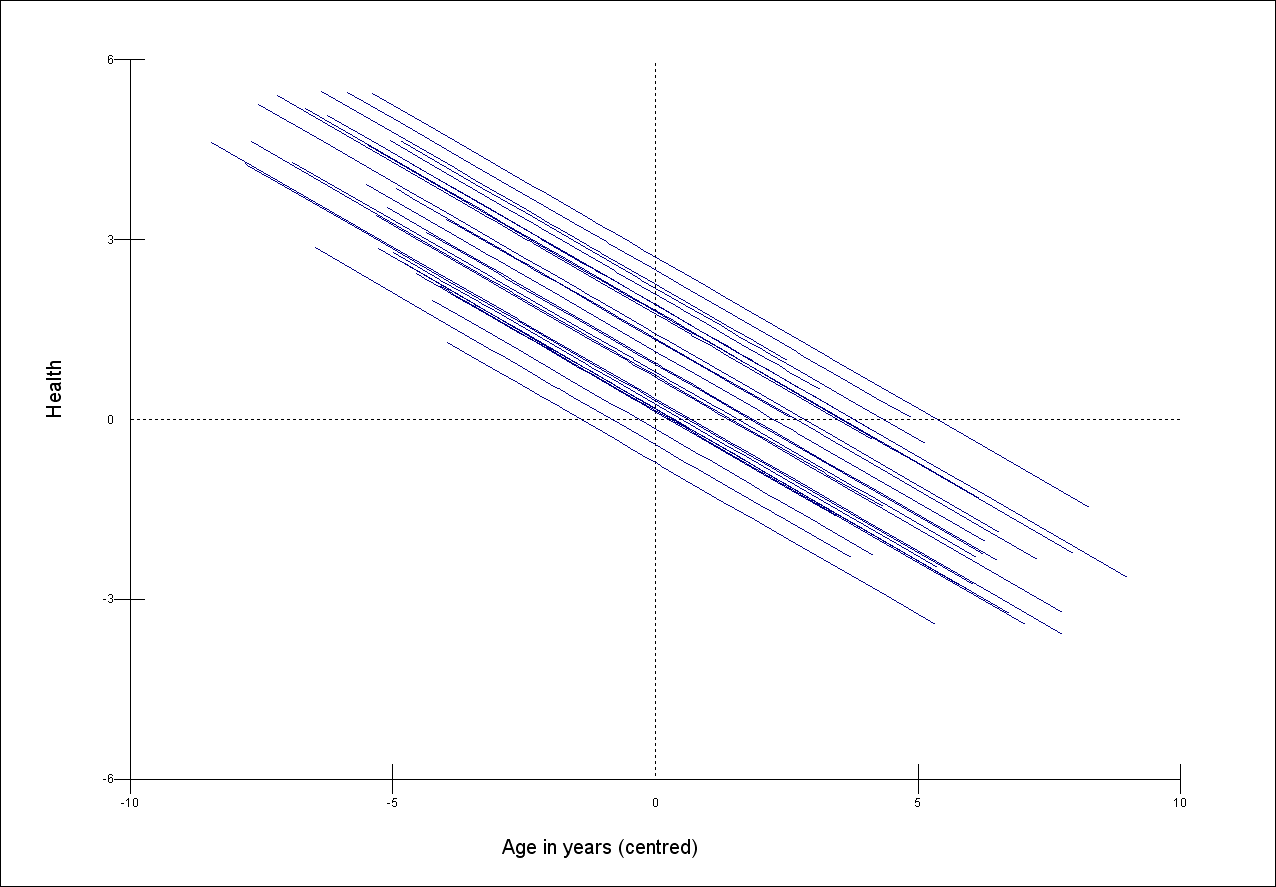
The following three graphs show the relationship between a self-reported measure of health (y) and age (x) in 30 areas of the UK.
The sample size per area and the within-area relationship between health and age is the same in each case. The scale of the y-axis is the same for each graph.
Match the graphs to the following descriptions of the relative sizes of their between area variance
A. Smallest B. Middle C. Largest

Question 2
A two-level model is fitted to estimate the amount of variance in self-reported health that it is between individuals (level 1) and between areas (level 2).
Two models are fitted.
Model 1: \(HEALTH_{ij}=\beta_0+AREA_{i}+\varepsilon_{ij}\) Model 1: \(HEALTH_{ij}=\beta_0+\beta_1*AGE_{ij}+AREA_{i}+\varepsilon_{ij}\)
In the first only area effects are included. The second model extends the first by including individual age as an explanatory variable, and a negative relationship between individual health and age is found.
The between-area variance, \(\sigma^2_{AREA}\) is compared for these two models.
For each of the following possible relationships between area means of health and age:
- No association
- Positive association
- Negative association
What is the expected change in the between-area variance after controlling for individual age? Will it
- decrease
- increase
- stay the same
Question 3
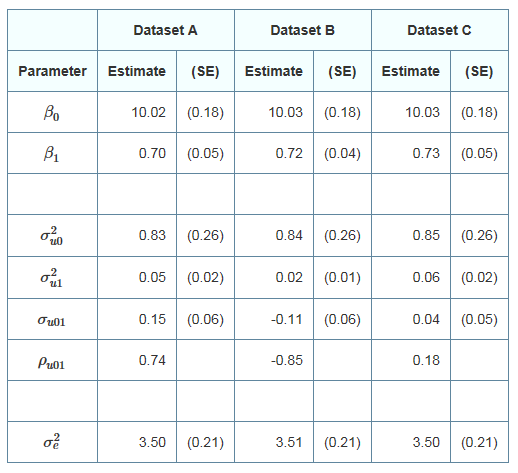
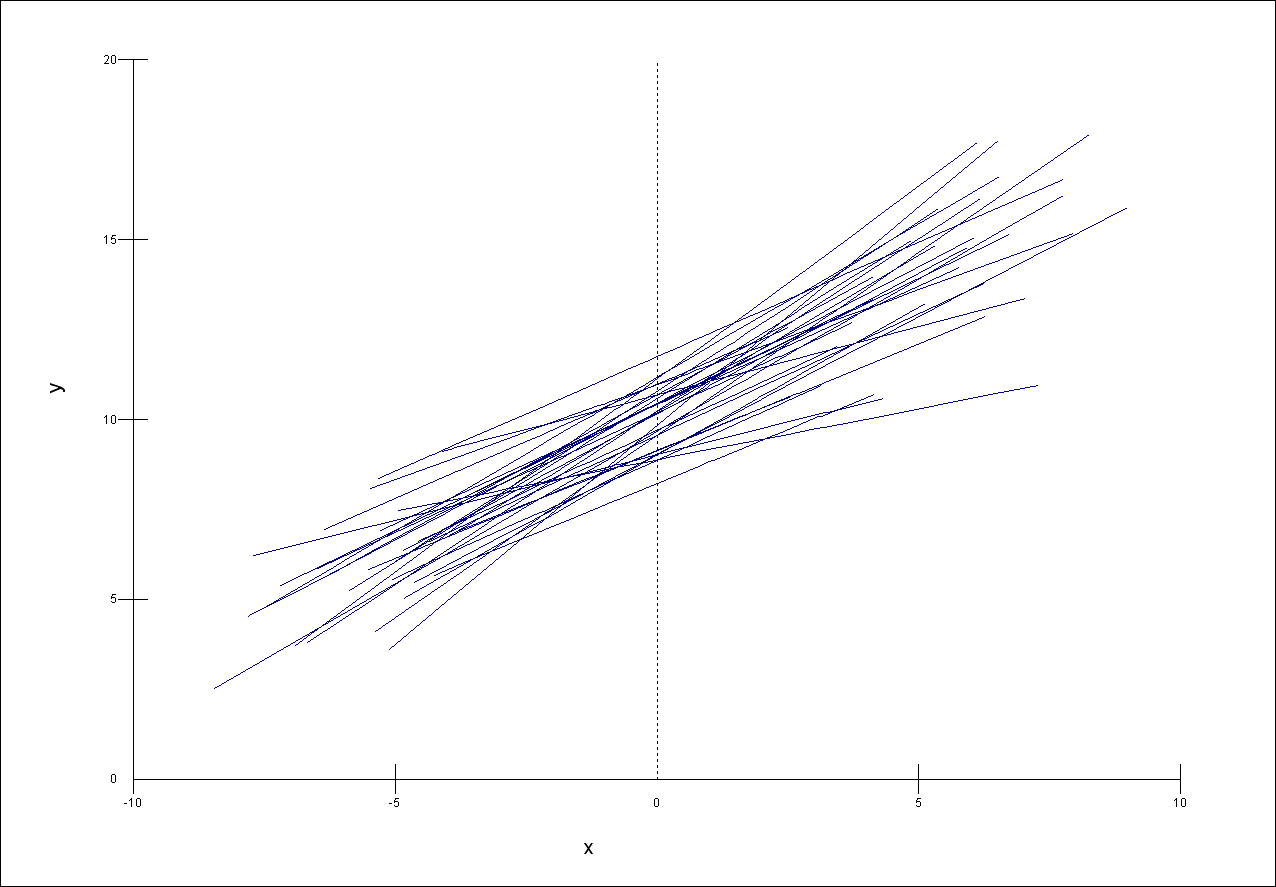
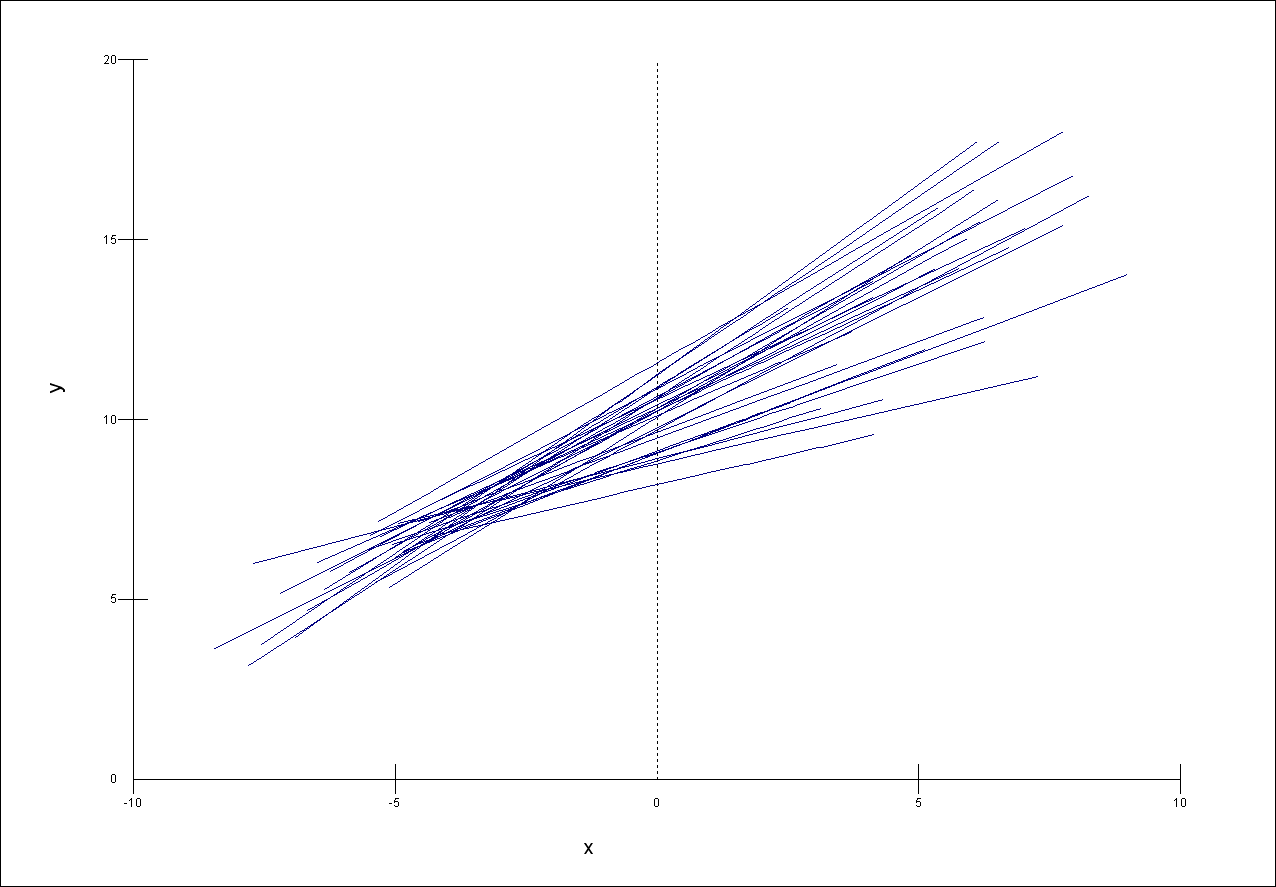
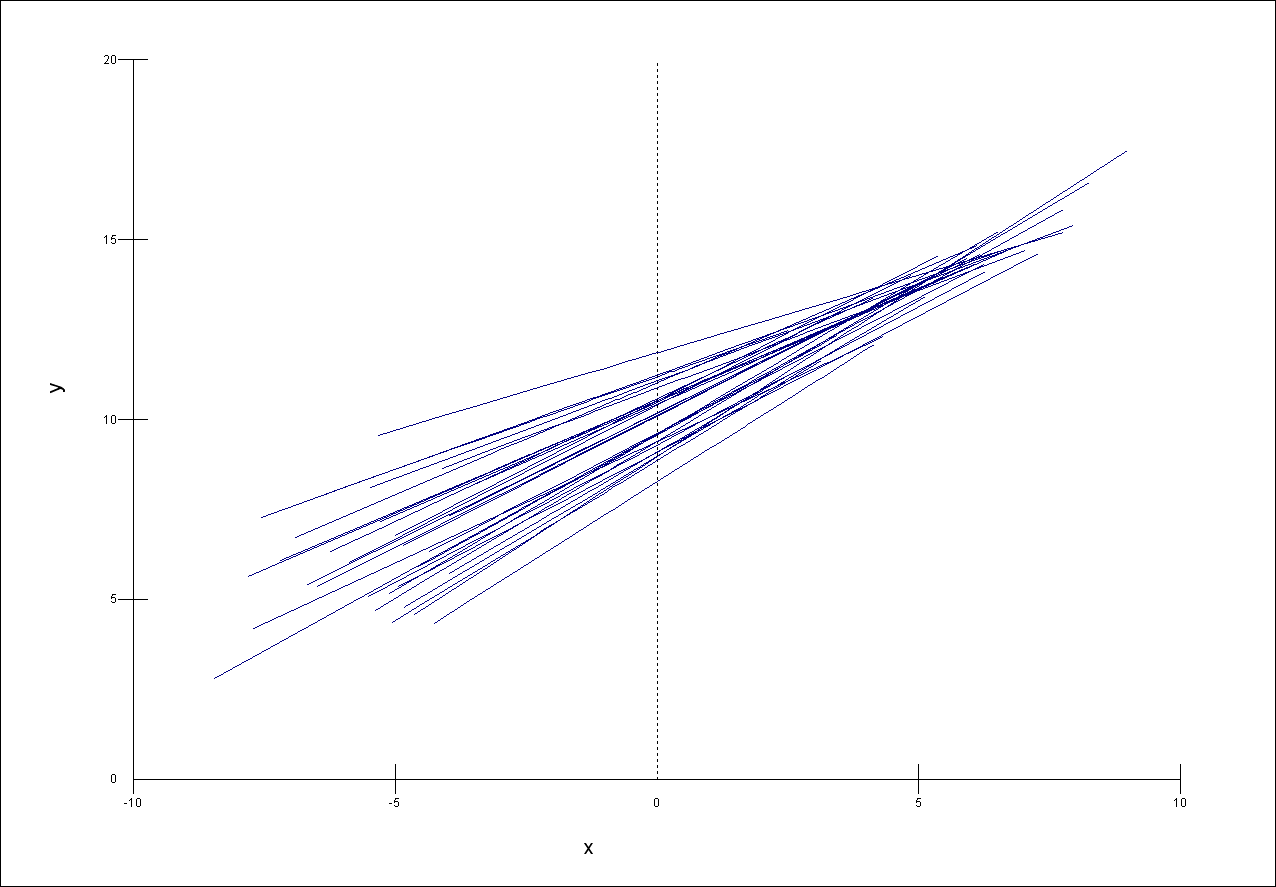
A random slope model was fitted to three datasets with a two-level structure (individuals in areas). The model was of the following form:
\[y_{ij}=\beta_0+\beta_1x_{ij}+u_{0i}+u_{1i}x_{ij}+\varepsilon_{ij}\] where the variances of \(u_{0i}\), \(u_{1i}\) and \(\varepsilon_{ij}\) are denoted \(\sigma^2_{u0}\), \(\sigma^2_{u1}\), and \(\sigma^2_{e}\) respectively. The covariance between \(u_{0i}\) and \(u_{1i}\) is denoted by \(\sigma_{u01}\), and the correlation by \(\rho_{u01}\).
The area level residuals \(u_{0i}\) and \(u_{1i}\) estimated and used to obtain prediction lines for each area. Match the results in the following table to the appropriate graph of the prediction lines. Note that each dataset can be matched to only one graph.
Results
 ### Question 4
What would happen to the estimate of \(\sigma^2_{u0}\) if 5 was subtracted from each value of x and the same model was refitted using these new x values? Would it
A. Increase B. Decrease C. Stay the same D. We won’t know unless we fit the model
Question 5
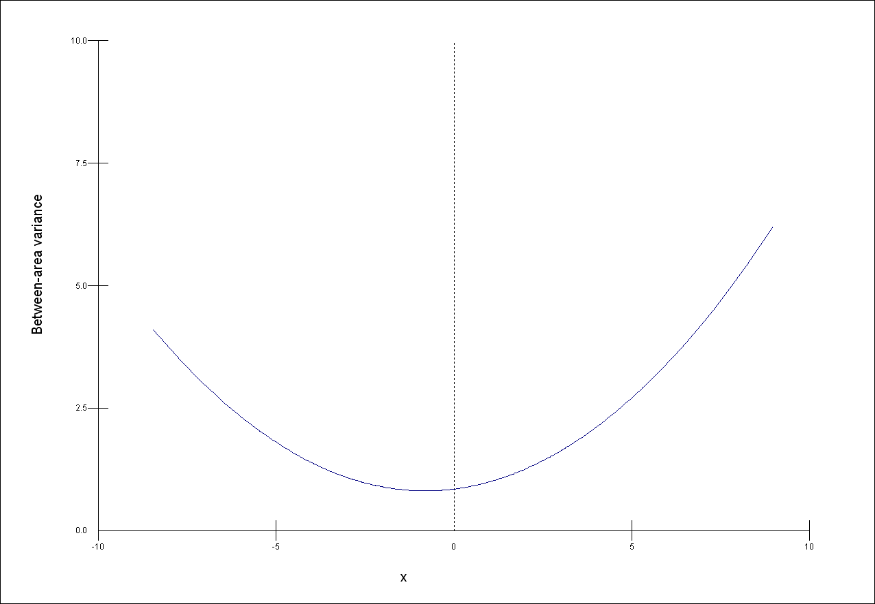
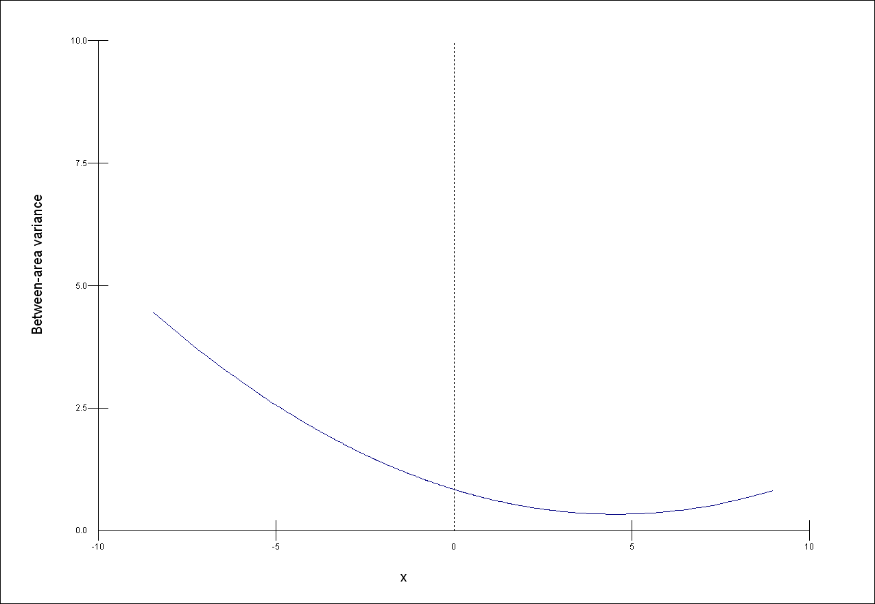
The first three graphs below show how the between area variance depends on the explanatory variable x.
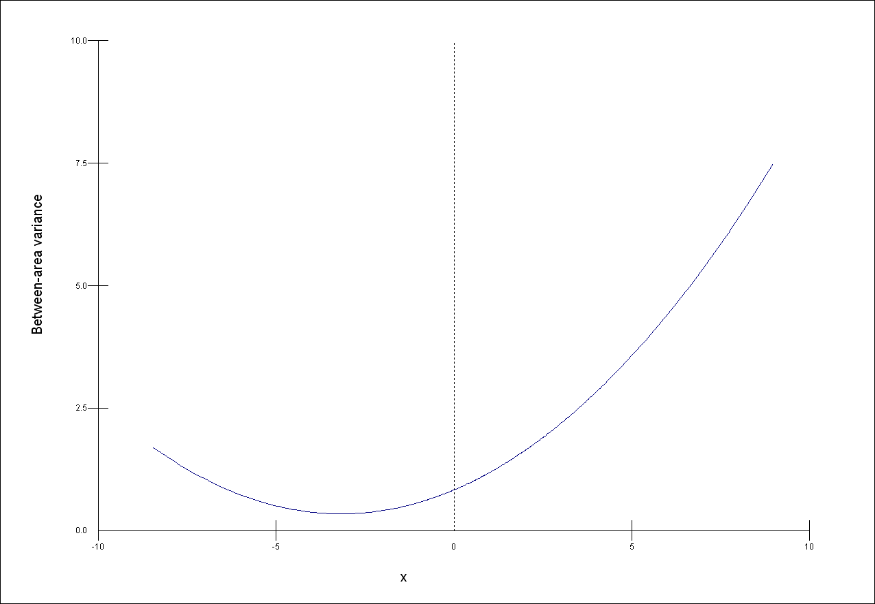
The next three graphs show the prediction lines for the relationship between x and y in each area.
1
2
3
Match each of the graphs of the prediction lines, 1, 2 and 3 to the appropriate graph, a, b and c of the between-area variance. Each graph a, b, and c matches to only one of 1, 2, and 3.