Hierarchical Structures
Two Level Hierarchical Data
Hierarchical structures arise when the lower-level unit nests in one and only one higher-level unit. Such a relatively simple structure can, as we shall see, accommodate a wide range of study designs and research questions. Other terms for hierarchical data are repeated measures data, clustered data, longitudinal data and multilevel data.
Repeated Measures Data
Repeated measures data refers to when there are multiple measures on the same subject, e.g., a pain intensity measure of back pain is taken at 1 month, 1 year, and 2 years after starting treatement on each patient. Here we have multiple measurement at different occassions (level 1) on different patients (level 2). With repeated measurements data, we can often expect measurements on the same individual to be more similar than measurements between different patients. For example, someone who started with a higher level of back pain will tend to still have a higher level of back pain on later follow-up visits than a patient who started with a lower level of back pain. That is, the patients back pain level at the 1 year follow-up is likely to be related to the back pain measurement at the 1 month follow-up. Multilevel models take this dependency across time into account and explicitly model it.
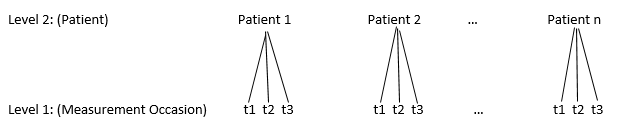
Unit Diagram of a two-level nested structure of follow-up visits within patients
Other potential variables that could be measured are age at start of treatment and reason for the back pain (level 2 variables) and time since the start of treatment (level 1 variable). In the following datasets, we have recorded the patient id, visit number, pain intensity score, time since start of treatment, and age at the start of treatment. This longitudinal data can be recorded in two different forms:
- wide format - a single row per subject.
| \(\text{Person}_i\) | Pain Visit 1 | Pain Visit 2 | Pain Visit 3 | Time 1 | Time 2 | Time 3 | Age |
|---|---|---|---|---|---|---|---|
| 1 | 88 | 60 | 15 | 1 | 12 | 24 | 55 |
| 2 | 65 | 20 | 5 | 1 | 12 | 24 | 35 |
| 3 | 35 | 14 | 0 | 1 | 12 | 24 | 42 |
- long format - a single row per measurement occasion
| \(\text{Person}_i\) | \(\text{Visit}_j\) | \(\text{Pain}_{ij}\) | \(\text{Time}_{j}\) | \(\text{Age}_i\) |
|---|---|---|---|---|
| 1 | 1 | 88 | 1 | 55 |
| 1 | 2 | 60 | 12 | 55 |
| 1 | 3 | 15 | 24 | 55 |
| 2 | 1 | 65 | 1 | 35 |
| 2 | 2 | 20 | 12 | 35 |
| 2 | 3 | 5 | 24 | 35 |
| 3 | 1 | 35 | 1 | 42 |
| 3 | 2 | 14 | 12 | 42 |
| 3 | 3 | 0 | 24 | 42 |
Data of this kind is usually recorded in wide form, but for analysis, we will need to change it to long form.
Clustered Data
Common methods for assessment of individual physicians’ performance at diabetes care were evaluated by studying 232 physicians from three sites caring for a total of 3,642 patients. Each physician was evaluated with regard to their ability to control \(\text{Hb1A}_{1c}\) levels (a measure of control of blood sugar levels) and with regard to resource utilization. Data was collected to make a single quantitative measure of diabetes care on each patient. With this type of data, we would expect patients with the same doctor to be more similar in terms of patient care than patients from different doctors. This data results in a two level structure of patients nested within doctors.
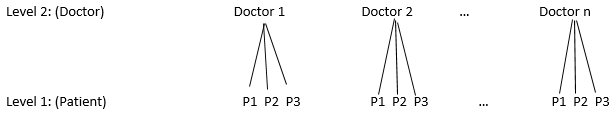
Unit Diagram of a two-level nested structure of patients within doctors
Two-Stage Sample Survey Design
In many large scale face-to-face surveys, the data collectors may adopt a two-stage design to minimize interviewer costs. In a study of health care accessibility, for example, the researchers may first select regions such as counties or neighborhoods, the primary sampling unit (PSU), and then select people to survey from within each region selected. This selection procedure leads to a sample that is geographically (spatially) clustered.
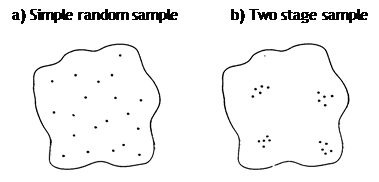
Random Sample vs TWo Stage Sample Design
Traditionally multistage designs are used to keep costs down as interviewers could be based in a particular PSU and not require extensive travel time. However, such a design was often seen as nuisance in the analysis. The problem is that multistage designs (usually) generate dependent data so that respondents living within the same PSU can be expected to be more alike than respondents selected at random from different PSUs.
Experiment with Intervention at Higher Level
Consider a cluster randomized trial on mammographic screening. The Swedish Two-County trial studied the efficacy of breast cancer screening on reducing the breast cancer rates. A problem particular to screening trials is contamination of the control group by the screening process. This may be because widespread publicity is needed to encourage women to come for screening, or because members of the screening group pass on information to neighbours who have been allocated to control, leading them to demand screening. This can be countered by using a larger sampling unit than the individual. We might, for example allocated whole towns to screening or control. In the Swedish Two Counties study of breast cancer, the screening process was randomly assigned to 14 out of 21 the entire parishes/municipalities in the county of Kopparberg and 12 out of 24 parishes/municipalities in Stergtland. Again, we now expect subjects from the same parish to be more similar than subjects from different parishes, so we can no longer think of the subjects as independent.
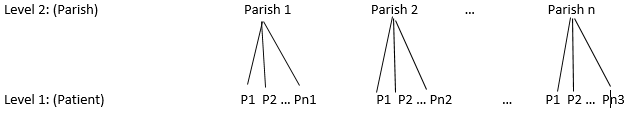
Two level structure of patient nested within parish
Three Level Structures
Treatment of Back Pain
Let’s revisit the back pain example. For the study, 44 primary care physicians in a large HMO were classified according to their practice style in treating back pain management (low, moderate, or high frequency of prescription of pain medication and bed rest). An average of 24 patients per physician were followed for 2 years (1month, 1 year, and 2 year followups) after the index visit. Outcomes included functional measures (pain intensity, activity limitation days, etc.), patient satisfaction (e.g., “After your visit with the doctor, you fully understood how to take care of your back problem”), and cost. We still have follow-up vists nested within patient, but we could also consider patients nested within doctors since patients seeing the same doctor probably are more similar due to similar care. Now, we have the following three level structure.
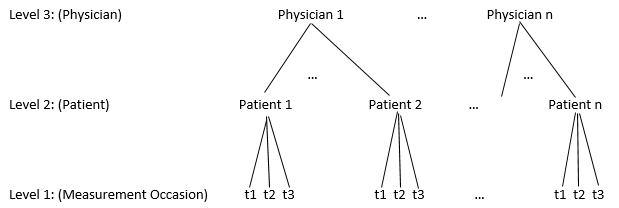
Three level structure of follow-up nested within patient nested within physician
Now, we can study both between patient and between physician variability. Some questions we might seek to answer here are
- Do physicians with different practice styles differ in function, satisfaction, or cost?
- How much of the variability in the responses is due to physician?
Four Level Structure
Back Pain Example
In the back pain example, we could also have multiple doctors in the same hospital, and the doctors from the same hospital could be more similar than doctors from different hospitals. This is another level of variability that we may need to account for by adding it to our hierarchy. Hospitals may differ in many different respects such as protocols, staffing, or equipment.
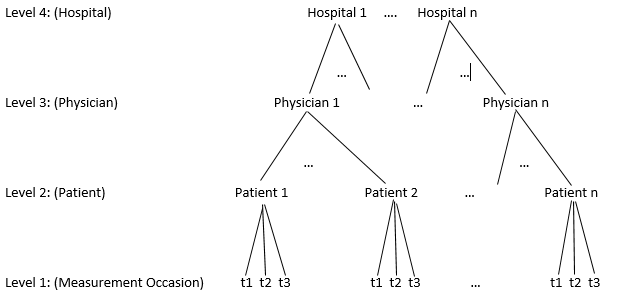
Four level structure of follow-up nested within patient nested within physician nested within hospital